


本文主要介绍了php使用jpgraph绘制简单x-y坐标图的方法,实例分析了jpgraph绘制坐标图及绘制曲线的相关技巧。希望对大家有所帮助。
具体实现方法如下:
SetScale("textlin"); //设置刻度样式
$graph->img->SetMargin(30,30,80,30); //设置图表边界
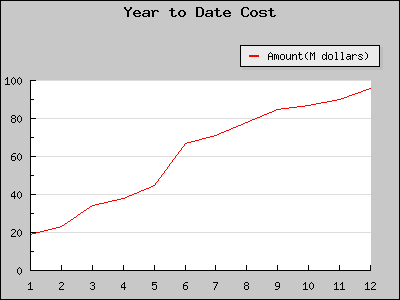
$graph->title->Set("Year to Date Cost"); //设置图表标题
// Create the linear plot
$lineplot=new LinePlot($data); // 创建新的LinePlot对象
$lineplot->SetLegend("Amount(M dollars)"); //设置图例文字
$lineplot->SetColor("red"); // 设置曲线的颜色
// Add the plot to the graph
$graph->Add($lineplot); //在统计图上绘制曲线
// Display the graph
$graph->Stroke(); //输出图像
?>运行后效果图如下:
相关推荐:
立即学习“PHP免费学习笔记(深入)”;


