


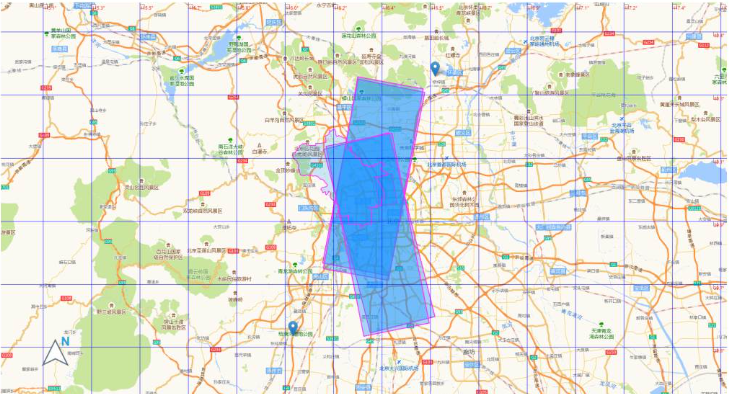
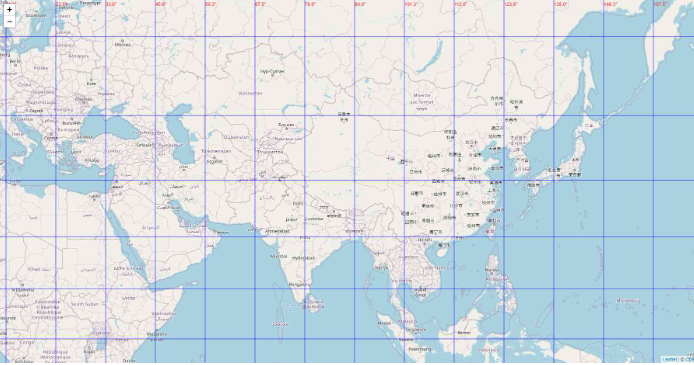
一、效果图
二、图层控制
在folium官方还提供了一些更明确的方法供我们使用。就比如图层的控制。官方给方法名称是FeatureGroup,导入方式时from folium import FeatureGroup,或者folium.FeatureGroup()。具体原理我这里就不细说了,主要还是看示例:
import folium
def map2png(map_data,out_file='pdf.png'):
# 1.直接构造,默认底图
mo = folium.Map(location=[0, 0])
# 2.图层1-高德底图+数据
fg = folium.FeatureGroup()
# 2.1 高德地图
fg.add_child(folium.TileLayer(
tiles='http://webrd02.is.autonavi.com/appmaptile?lang=zh_cn&size=1&scale=1&style=8&x={x}&y={y}&z={z}',
attr="© <a href=http://ditu.amap.com/>高德地图</a>",
min_zoom=0,
max_zoom=19,
control=True,
zoom_control=False,
show=True))
# 2.2添加一个点
fg.add_child(folium.Marker(
location=[45.3311, -121.7113],
popup="Timberline Lodge",
icon=folium.Icon(color="green")))
# 2.3添加一个线形
fg.add_child(folium.PolyLine(
locations=[[38.68,115.67],
[38.85,115.48],
[38.65,115.37],
[38.68,115.67]],
color='green', weight=2, opacity=1))
# 2.4添加一个面
fg.add_child(folium.Polygon(
locations=[[38.68,115.67],
[38.85,115.48],
[38.65,115.37],
[38.68,115.67]],
color='green', weight=2,
fill=True,fill_color = 'red'))
# 2.5将我们的图层加入map
mo.add_child(fg)
# 3.图层2-重点数据+最上层
fg2 = folium.FeatureGroup()
fg2.add_child(folium.Polygon(
locations=[[38.68,115.67],
[38.85,115.48],
[38.65,115.37],
[38.68,115.67]],
color='green', weight=2,
fill=True,fill_color = 'red'))
mo.add_child(fg2)
# 4.将图层fg2显示在最上层,keep_in_front的参数必须是FeatureGroup或TileLayer对象
mo.keep_in_front(fg2)
# 5.根据范围缩放地图
mo.fit_bounds([[38.68,115.67],
[38.85,115.48],
[38.65,115.37],
[38.68,115.67]])
root = mo.get_root()
html = root.render() # 这个拿到的就是一个html的内容
# mo.save('text.html')三、指北针
指北针这个功能对于地图来说不一定是必须的,但是加上总是好的。FloatImage的使用可以实现该功能,尽管官方文档和源码分析中并未提及相关内容。官方文档中提供了很多插件,其中使用最广泛的是称为热力图的HeatMap方法。
FloatImage方法实现的是将一张图片放到屏幕上,并指定图片的大小,和屏幕上的位置,参数为为整数(FloatImage方法实现了百分比转化)。我们在二代码的基础上,将图片加在了左下角。
fg.add_child(FloatImage(os.path.join(base, 'map_png', 'image', 'compass.png'), left=5, bottom=10, width=5))
四、folium添加js和css
folium官方未提供添加js和css的相关方法,网上很多方法应该都是在解读源码的基础上进行的抽取,相对来说比较的单一,没有针对如何添加js和css进行相关说明。
立即学习“Python免费学习笔记(深入)”;
从源代码中可以知道,folium中实现地图功能是通过jinjia2实现数据和地图加载html的。
源码中主要使用了三种添加数据和地图的方法。这些方法存在缺陷(只能加在最前面),这些方法可以使用大多数场景,如果不涉及对map对象的操作,此三种方法可以满足要求。
1.header添加js和css
    init_script = """
        var mapsPlaceholder = [];
        L.Map.addInitHook(function () {mapsPlaceholder.push(this);});
    """
    # 加在header最上边
    mo.get_root().header.add_child(folium.Element(init_script))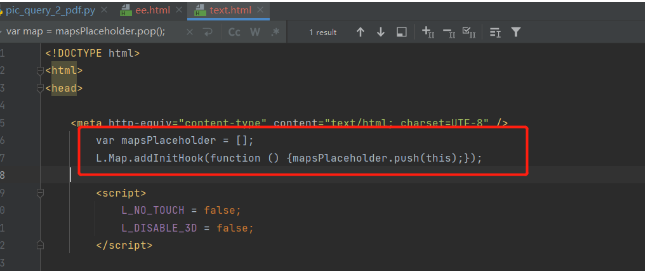
2.body添加js和css
    init_script = """
        var mapsPlaceholder = [];
        L.Map.addInitHook(function () {mapsPlaceholder.push(this);});
    """
    # 加在body中
    mo.get_root().html.add_child(folium.Element(init_script))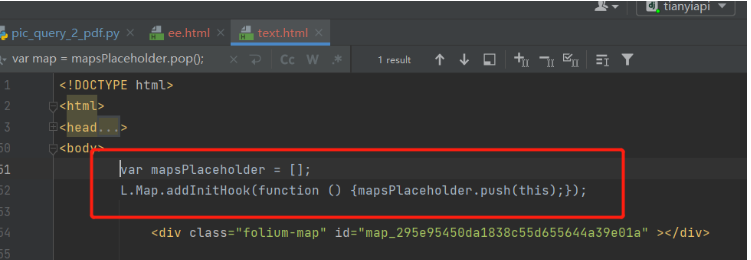
3.script添加js和css
    init_script = """
        var mapsPlaceholder = [];
        L.Map.addInitHook(function () {mapsPlaceholder.push(this);});
    """
    # 加在script中
    mo.get_root().script.add_child(folium.Element(init_script))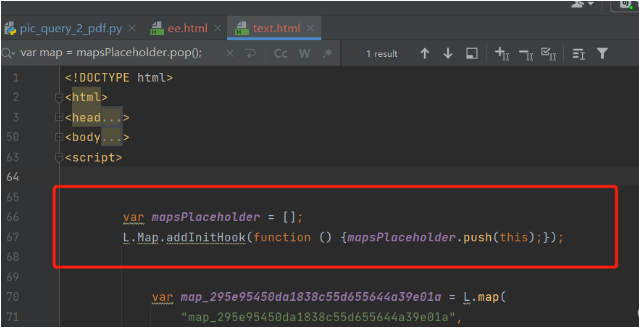

五、经纬网格线
上一步实现了在html文件不同位置添加js和css的方法,如果涉及到对map对象的操作,可能存在不满足的情况,比如添加经纬网格线。实现经纬网格线这个功能比较麻烦,主要存在以下困难:
1.官方没有相关的方法和插件(目前没有);
2.folium是依赖leadlet.js实现的第三方库,想实现经纬线需要熟悉leaflet(在网上只找到一篇相关文章);
3.上边的文章是前端完成,没有直接后端实现的方法。
4.前端实现的方法是直接构建的地图,我们这里是地图创建对象不可获取(地图对象随机生成)。
如何才能事项经纬网格线呢?
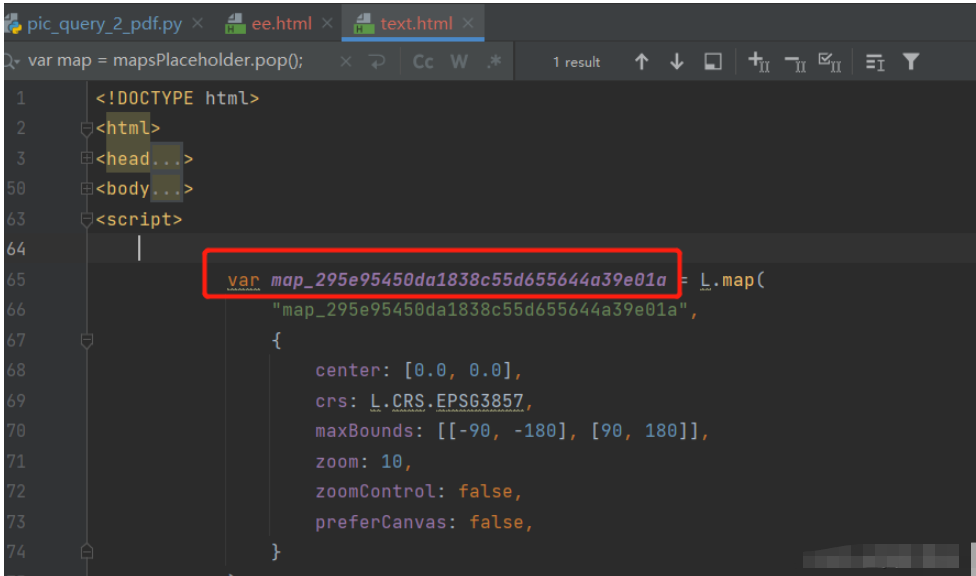
我们需要将对象存储在创建map对象时,然后获取map对象并根据缩放级别实现网格线。一个重要的任务是确保在创建map对象之前和之后将javascript代码正确地嵌入到html页面中。
其中map对象创建时将对象存储在四中已经实现,通过学习folium源码,重写了添加js的方法实现map对象创建后添加js。
1.html页面实现经纬度网格
<!DOCTYPE html>
<html lang="en">
<head>
<meta charset="UTF-8" />
<meta http-equiv="X-UA-Compatible" content="IE=edge" />
<meta name="viewport" content="width=device-width, initial-scale=1.0" />
<link
rel="stylesheet"
href="https://unpkg.com/leaflet@1.7.1/dist/leaflet.css" rel="external nofollow"
/>
<script src="https://unpkg.com/leaflet@1.7.1/dist/leaflet.js"></script>
<title>leaflet-经纬网格</title>
<style>
html,
body {
width: 100%;
height: 100%;
padding: 0;
margin: 0;
}
.leaflet-div-icon {
background: none;
border: none;
}
</style>
</head>
<body>
<div id="map" ></div>
<script>
let map = L.map("map", { renderer: L.canvas({ padding: 0.5 }) }).setView(
[25.127879288597576, 118.37905883789064],
4
);
// 添加背景图层
L.tileLayer("https://{s}.tile.openstreetmap.org/{z}/{x}/{y}.png", {
attribution:
'© <a href="https://www.openstreetmap.org/copyright" rel="external nofollow" >OpenStreetMap</a> contributors',
}).addTo(map);
// 创建图层
let lonLatGridLineLayer = L.featureGroup().addTo(map);
// 经纬网格生成方法
let addLonLatLine = () => {
let zoom = map.getZoom();
let bounds = map.getBounds();
let north = bounds.getNorth();
let east = bounds.getEast();
// 经纬度间隔
let d = 90 / Math.pow(2, zoom - 1);
// 经线网格
for (let index = -180; index <= 360; index += d) {
// 判断当前视野内
if (bounds.contains([north, index])) {
// 绘制经线
let lonLine = L.polyline(
[
[-90, index],
[90, index],
],
{ weight: 1, color: "blue" }
);
lonLatGridLineLayer.addLayer(lonLine);
// 标注
let text = index.toFixed(1) + "°";
// 动态计算小数位数
if (zoom > 10) {
text = index.toFixed((zoom - 8) / 2) + "°";
}
let divIcon = L.divIcon({
html: `<div >${text}</div>`,
iconAnchor: [0, -5],
});
let textMarker = L.marker([north, index], { icon: divIcon });
lonLatGridLineLayer.addLayer(textMarker);
}
}
if(d>90)d=90;
// 纬线网格
for (let index = -90; index <= 90; index += d) {
if (bounds.contains([index, east])) {
let lonLine = L.polyline(
[
[index, -180],
[index, 360],
],
{ weight: 1, color: "blue" }
);
lonLatGridLineLayer.addLayer(lonLine);
// 标注
let text = index.toFixed(1) + "°";
if (zoom > 10) {
text = index.toFixed((zoom - 8) / 2) + "°";
}
let divIcon = L.divIcon({
html: `<div >${text}</div>`,
iconAnchor: [(text.length + 1) * 6, 0],
});
let textMarker = L.marker([index, east], { icon: divIcon });
lonLatGridLineLayer.addLayer(textMarker);
}
}
};
addLonLatLine();
map.on("zoomend move", () => {
lonLatGridLineLayer.clearLayers();
addLonLatLine();
});
</script>
</body>
</html>2.自定义网格线的类
通过源码的类继承关系,我采取继承MacroElement类。
from branca.element import MacroElement,
from jinja2 import Template
from folium.vector_layers import path_options

class Jwwg(MacroElement):
    """自定义经纬线网格"""
    _template = Template("""
        {% macro script(this, kwargs) %}
                    var map = mapsPlaceholder.pop();
                    // 创建图层
                    let lonLatGridLineLayer = L.featureGroup().addTo(map);
                    // 经纬网格生成方法
                    let addLonLatLine = () => {
                        let zoom = map.getZoom();
                        let bounds = map.getBounds();
                        let north = bounds.getNorth();
                        let east = bounds.getEast();
                        // 经纬度间隔
                        let d = 90 / Math.pow(2, zoom - 1);
                        // 经线网格
                        for (let index = -180; index <= 360; index += d) {
                            // 判断当前视野内
                            if (bounds.contains([north, index])) {
                                // 绘制经线
                                let lonLine = L.polyline(
                                    [
                                        [-90, index],
                                        [90, index],
                                    ],
                                    {weight: 1, color: "blue"}
                                );
                                lonLatGridLineLayer.addLayer(lonLine);
                                // 标注
                                let text = index.toFixed(1) + "°";
                                // 动态计算小数位数
                                if (zoom > 10) {
                                    text = index.toFixed((zoom - 8) / 2) + "°";
                                }
                                let divIcon = L.divIcon({
                                    html: `<div >${text}</div>`,
                                    iconAnchor: [0, -5],
                                });
                                let textMarker = L.marker([north, index], {icon: divIcon});
                                lonLatGridLineLayer.addLayer(textMarker);
                            }
                        }
                        if (d > 90) d = 90;
                        // 纬线网格
                        for (let index = -90; index <= 90; index += d) {
                            if (bounds.contains([index, east])) {
                                let lonLine = L.polyline(
                                    [
                                        [index, -180],
                                        [index, 360],
                                    ],
                                    {weight: 1, color: "blue"}
                                );
                                lonLatGridLineLayer.addLayer(lonLine);
                                // 标注
                                let text = index.toFixed(1) + "°";
                                if (zoom > 10) {
                                    text = index.toFixed((zoom - 8) / 2) + "°";
                                }
                                let divIcon = L.divIcon({
                                    html: `<div >${text}</div>`,
                                    iconAnchor: [(text.length + 1) * 6, 0],
                                });
                                let textMarker = L.marker([index, east], {icon: divIcon});
                                lonLatGridLineLayer.addLayer(textMarker);
                            }
                        }
                    };
                    addLonLatLine();
                    map.on("zoomend move", () => {
                        lonLatGridLineLayer.clearLayers();
                        addLonLatLine();
                    });
                   {% endmacro %}
                """)

    def __init__(self, **kwargs):
        super(Jwwg, self).__init__()
        self._name = 'Jwwg'
        self.options = path_options(line=True, **kwargs)
3.实现网格线
import folium
def map2png(map_data,out_file='pdf.png'):
# 1.直接构造,默认底图
mo = folium.Map(location=[0, 0])
# 2.图层1-高德底图+数据
fg = folium.FeatureGroup()
# 2.1 高德地图
fg.add_child(folium.TileLayer(
tiles='http://webrd02.is.autonavi.com/appmaptile?lang=zh_cn&size=1&scale=1&style=8&x={x}&y={y}&z={z}',
attr="© <a href=http://ditu.amap.com/>高德地图</a>",
min_zoom=0,
max_zoom=19,
control=True,
zoom_control=False,
show=True))
# 2.2添加一个点
fg.add_child(folium.Marker(
location=[45.3311, -121.7113],
popup="Timberline Lodge",
icon=folium.Icon(color="green")))
# 2.3添加一个线形
fg.add_child(folium.PolyLine(
locations=[[38.68,115.67],
[38.85,115.48],
[38.65,115.37],
[38.68,115.67]],
color='green', weight=2, opacity=1))
# 2.4添加一个面
fg.add_child(folium.Polygon(
locations=[[38.68,115.67],
[38.85,115.48],
[38.65,115.37],
[38.68,115.67]],
color='green', weight=2,
fill=True,fill_color = 'red'))
# 2.5将我们的图层加入map
mo.add_child(fg)
# 5.根据范围缩放地图
mo.fit_bounds([[38.68,115.67],
[38.85,115.48],
[38.65,115.37],
[38.68,115.67]])
# 网格线
init_script = """
var mapsPlaceholder = [];
L.Map.addInitHook(function () {mapsPlaceholder.push(this);});
"""
mo.get_root().script.add_child(folium.Element(init_script))
Jwwg().add_to(mo)
root = mo.get_root()
html = root.render() # 这个拿到的就是一个html的内容
# mo.save('text.html') 


