
最近在做一个pc的项目,要把echarts图表在bootstrap模态框里展示,用户点击按钮弹出内容为echarts图表的modal。
一、先搞一个模态框出来~
HTML:
JS:
$('.btn').click(function(){
    $('#myModal').modal();//点击按钮弹出模态框
})
二、渲染图表:
$.ajax({//发送请求
    url : BASE_URL + "/index/search",
    data : {
        "keyword" : keyword
    },
    type : 'GET',
    dataType : 'json',
    success : function(data.data){//拿回数据
        var data = data.data;
        var myChart = echarts.init(document.getElementById('box'));//初始echarts
        option = {//配置图表(从echarts官网示例上扒的option,可忽略)
        backgroundColor: new echarts.graphic.RadialGradient(0.3, 0.3, 0.8, [{
            offset: 0,
            color: '#f7f8fa'
        }, {
            offset: 1,
            color: '#cdd0d5'
        }]),
        title: {
            text: '1990 与 2015 年各国家人均寿命与 GDP'
        },
        legend: {
            right: 10,
            data: ['1990', '2015']
        },
        xAxis: {
            splitLine: {
                lineStyle: {
                    type: 'dashed'
                }
            }
        },
        yAxis: {
            splitLine: {
                lineStyle: {
                    type: 'dashed'
                }
            },
            scale: true
        },
        series: [{
            name: '1990',
            data: data[0],
            type: 'scatter',
            symbolSize: function (data) {
                return Math.sqrt(data[2]) / 5e2;
            },
            label: {
                emphasis: {
                    show: true,
                    formatter: function (param) {
                        return param.data[3];
                    },
                    position: 'top'
                }
            },
            itemStyle: {
                normal: {
                    shadowBlur: 10,
                    shadowColor: 'rgba(120, 36, 50, 0.5)',
                    shadowOffsetY: 5,
                    color: new echarts.graphic.RadialGradient(0.4, 0.3, 1, [{
                        offset: 0,
                        color: 'rgb(251, 118, 123)'
                    }, {
                        offset: 1,
                        color: 'rgb(204, 46, 72)'
                    }])
                }
            }
        }, {
            name: '2015',
            data: data[1],
            type: 'scatter',
            symbolSize: function (data) {
                return Math.sqrt(data[2]) / 5e2;
            },
            label: {
                emphasis: {
                    show: true,
                    formatter: function (param) {
                        return param.data[3];
                    },
                    position: 'top'
                }
            },
            itemStyle: {
                normal: {
                    shadowBlur: 10,
                    shadowColor: 'rgba(25, 100, 150, 0.5)',
                    shadowOffsetY: 5,
                    color: new echarts.graphic.RadialGradient(0.4, 0.3, 1, [{
                        offset: 0,
                        color: 'rgb(129, 227, 238)'
                    }, {
                        offset: 1,
                        color: 'rgb(25, 183, 207)'
                        }])
                    }
                }
            }]
        };
        myChart.setOption(option);//渲染图表
    }
})
此时我们可能以为这个功能已经成功了,但其实这里有一个小坑,如图:
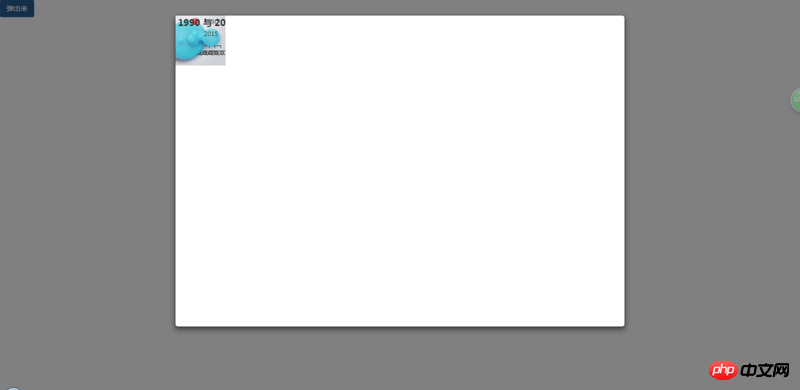
图表会变成一坨,而不是自适应撑满整个容器。


Copyright 2014-2026 https://www.php.cn/ All Rights Reserved | php.cn | 湘ICP备2023035733号


 1
1 2049
2049


业精于勤,荒于嬉;行成于思,毁于随。